The transition to maritime DC microgrids demands advanced protection strategies. Traditional AC time-current curves from standard product catalogues fall short when predicting fuse behaviour during fast, complex DC transients. When fault currents escalate within 2 to 3 ms, power-system engineers need dynamic, validated models to guarantee selectivity and component survival.
In this new technical white paper, Peter van den Berg (Senior Technical Consultant Power Electronics at Astrolkwx), with contributions from László Kristóf (Eaton), shares a highly robust, science-backed methodology for modelling high-speed semiconductor fuses (principally utilisation category aR).
Executive summary
This technical white paper addresses the representation of high-speed semiconductor fuse-links, principally utilization category aR, in dynamic simulations of maritime DC microgrids. The application is centered on nominal 1,000 V DC systems and considers the emerging equipment and system class extending toward 1,500 V DC.
Under fast fault-current time constants (frequently below 2 to 3 ms), conventional AC time-current characteristics and standardised DC test assumptions do not necessarily describe the actual fault waveform or post-melting interruption duty. Therefore, pre-arcing behaviour should be assessed from the actual simulated current waveform.
Purpose & principal conclusion
This paper defines a defensible method for representing high-speed semiconductor fuses in dynamic DC-microgrid studies. It separates pre-arcing prediction, DC interruption verification, system discrimination, and assembly withstand verification. The ultimate result is a model whose fidelity is perfectly matched to the engineering decision being made. The principal conclusion shows that a detailed arcing representation is only necessary where that specific interval can change a compliance, coordination, or component-survival conclusion; otherwise, a bounded or manufacturer-validated representation is more defensible than an unverified detailed model.
Key insights inside this white paper:
- The limits of catalogue data: Why standard curves cannot uniquely define DC transient states or dynamic arc behaviour.
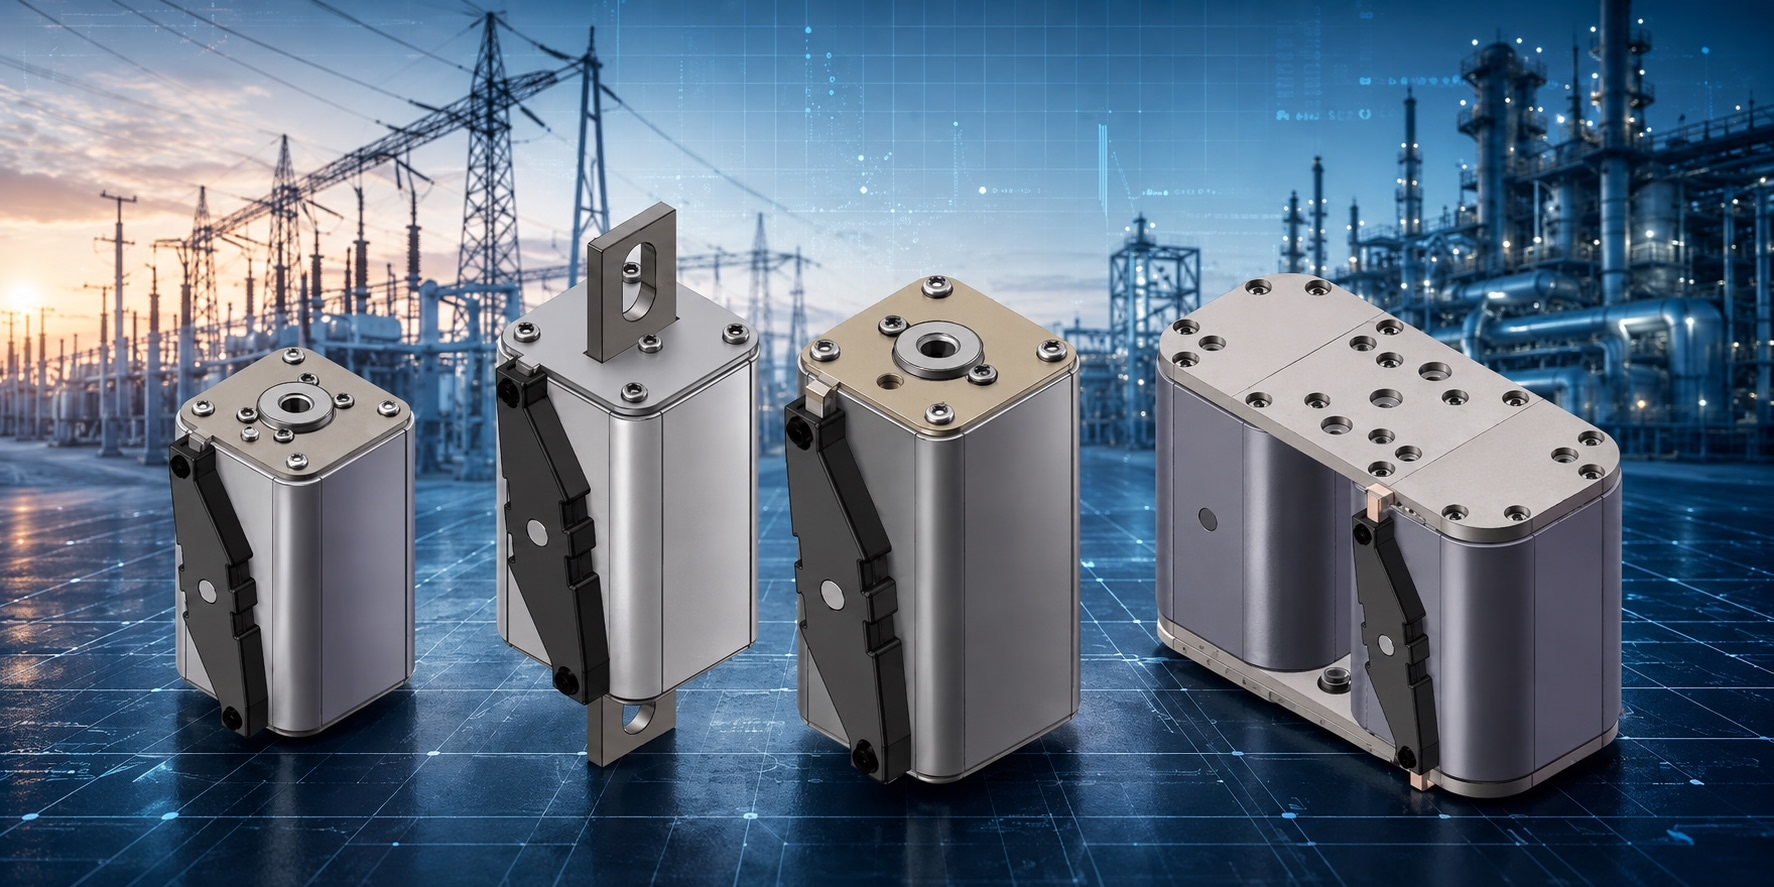
- Exclusive testing insights: An in-depth analysis of the Eaton Bussmann 180D series (350 A to 1,400 A) under rigorous 1,500 V DC test conditions with an extremely low time constant (L/R = 3 ms).
- Simulation consequences: How to build reliable Level 1 and Level 2 melting models in Simulink or Simscape without relying on inaccurate AC-to-DC voltage extrapolation.
- Practical 8-step validation workflow: A structured engineering checklist ranging from defining verification objectives to archiving auditable simulation data.
- Failure modes & mitigations: An overview of critical design pitfalls, such as assuming equal current sharing in parallel fuse arrangements without manufacturer validation.
More information and download request
Your download is available
Frequently Asked Questions (FAQ)
Traditional AC curves rely on symmetrical RMS currents and periodic zero-crossings. Maritime DC faults are composite, fast transients (frequently under 2–3 ms) with no natural current zero, meaning AC data cannot accurately predict the fuse’s dynamic arcing behavior or post-melting interruption duty.
Level 1 models the actual-waveform pre-arcing interval followed by an ideal opening. Level 2 adds a bounded arcing interval using verified manufacturer limits for total I²t, peak let-through, and arc voltage. Level 3 utilizes a fully manufacturer-validated, test-calibrated dynamic arc model.
A detailed Level 3 dynamic arc model is required only when the post-melting arcing interval can materially alter the engineering conclusion, such as in cases involving critical selectivity, component/semiconductor survival, or conditional assembly short-circuit withstand ratings.
A short circuit time constant indicates lower system inductance and less stored magnetic energy to absorb during arcing. While it can accelerate melting and increase early peak electrical stress, it reduces one component of the post-melting interruption burden.
Pre-arcing time is the interval from fault initiation until the fuse element physically melts. Clearing time is the total duration required to completely interrupt the fault, comprising both the pre-arcing time and the subsequent arcing interval.
No, catalogue total-clearing I²t must never be used as a melting trigger. Pre-arcing must be determined by integrating the actual simulated current waveform against the cold minimum pre-arcing I²t or by utilizing a calibrated electrothermal model.
Parallel and series installations experience manufacturing tolerances, individual temperature differences, and dynamic current redistribution after the first element starts to melt. Each fuse-link must be modelled with its own individual thermal state and tolerances to prevent underestimating individual fuse duty.
Classification reviewers often require less detailed fuse clearing evidence when the switchgear assembly has a substantial verified DC short-time and peak withstand margin. A rating headroom of about 25% represents project experience where detailed clearing analysis may become non-decisive for structural survival.